Investors
Value creation
Investment case
We operate in a growth market with significant opportunities for long-term value creation through active asset management and development. This drives rental income and supports values, delivering attractive, sustainable returns for our shareholders.

Compelling, long-term market trends
Occupier demand is underpinned by strong and enduring structural themes including the growth of e-commerce and supply chain resilience which have accelerated due to the pandemic, Brexit and the war in Ukraine. Location is key for occupiers and supply of the right type of space in economically attractive places is constrained due to planning restrictions. Together, these dynamics support long-term rental growth.

Attractive and resilient portfolio
Our portfolio is primarily focused on multi-let assets where we have the flexibility to attract a wider mix of occupiers to create enhanced performance through asset management. Our assets are close to urban centres and major transport routes and we have a significant presence in key industrial hubs in the Midlands, North West and the Arc centred on Milton Keynes.

Total returns focused strategy
We target an average total accounting return of at least 10.0% per annum through a combination of dividends and NAV growth (average of 10.8% since IPO). We drive like-for-like income growth through active asset management across our portfolio, which is highly reversionary. We deliver future income growth through the selective development of opportunities we have created, and these activities support long-term value creation.
Sound financial position
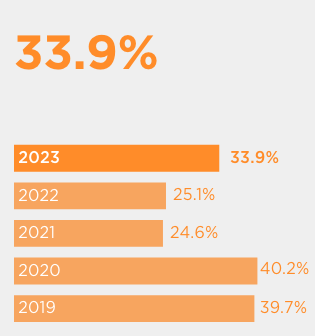
Our LTV is at the lower end of our range at 33.9% and we benefit from a range of funding sources and significant headroom to our covenants, providing the flexibility to pursue opportunities in the market and on our portfolio to drive returns.
Experienced management team
We have an experienced Board and a highly knowledgeable Investment Advisor in Tilstone, which gives us a deep understanding of the sector and a wide network of industry contacts through which we can source investments.
Key performance indicators
We use the following key performance indicators (“KPIs”) to monitor our performance and strategic progress.
Occupancy (%)
Description
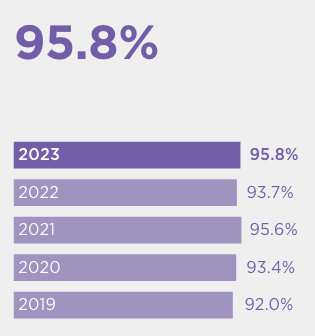
Total open market rental value of the units leased divided by total open market rental value, excluding development property and land, and equivalent to one minus the EPRA vacancy rate.Why is this important?
Shows our ability to retain occupiers at renewal and to let vacant space, which in turn underpins our income and dividend payments.How we performed
Active asset management, asset disposals and the robust occupational market helped us to increase occupancy during the year to 95.8%.Like-for-like rental income growth (%)
Description
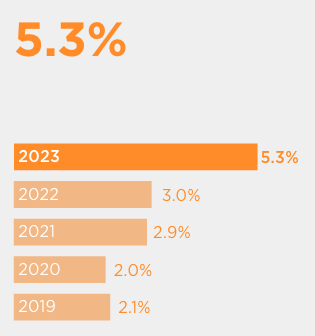
The increase in contracted rent of units owned throughout the period, expressed as a percentage of the contracted rent at the start of the period, excluding development property, land and units undergoing refurbishment.Why is this important?
Shows our ability to identify and acquire attractive properties and grow average rents over time.How we performed
We delivered further good rental growth, as we continued to capture the reversionary potential in the portfolio through active asset management.Rental increases agreed versus valuer’s ERV (%)
Description
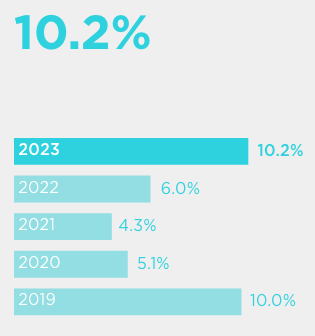
The difference between the rent achieved on new lettings and renewals and the ERV assessed by the external valuer, expressed as a percentage above the ERV at the start of the period.Why is this important?
Shows our ability to achieve rental growth ahead of ERV through asset management and the attractiveness of our assets to potential occupiers.How we performed
We maintained our track record of achieving rental levels ahead of ERV.Like-for-like valuation increase (%)
Description
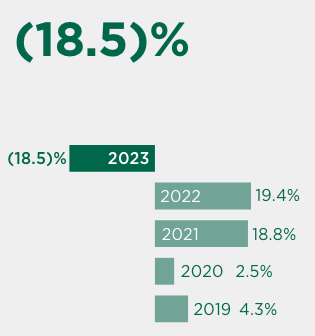
The change in the valuation of properties owned throughout the period under review, expressed as a percentage of the valuation at the start of the period, and net of capital expenditure.Why is this important?
Shows our ability to acquire the right quality of assets at attractive valuations, add value through asset management and drive increased capital values by capturing rental growth.How we performed
After two years of exceptionally strong valuation increases, investment market conditions led to an 18.5% fall in the like-for-like valuation.Total cost ratio (%)
Description
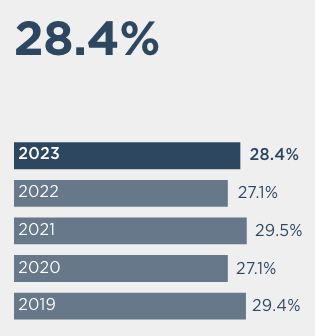
EPRA cost ratio including direct vacancy costs but excluding one-off costs. The EPRA cost ratio is the sum of property expenses and administration expenses, as a percentage of gross rental income. (See table 6 on page 147 for detail).Why is this important?
Shows our ability to effectively control our cost base, which in turn supports dividend payments to shareholders.How we performed
The total cost ratio increased in the year due to non-recoverable holding costs on larger vacant buildings. Excluding vacancy costs, the EPRA cost ratio was 26.8%.EPRA NTA per share (p)
Description
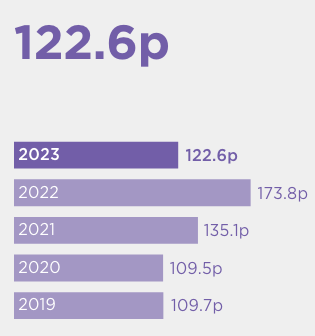
This net asset value measure assumes entities buy and sell assets, thereby crystallising certain levels of deferred tax liability. The measure excludes the fair value of financial instruments that are used for hedging purposes where the Company has the intention of keeping the hedge position until the end of the contract duration (this is regardless of whether hedge accounting under IFRS is applied). (See table 6 on page 147 for detail).Why is this important?
Shows our ability to acquire well and to increase capital values through active asset management.How we performed
The decline in capital values relative to the market contributed to a 29.5% reduction in EPRA NTA per share.Dividends per share (p)
Description
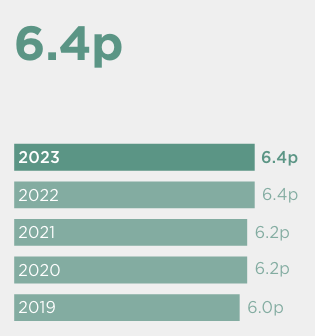
The total amount of dividends paid or declared in respect of the financial year, divided by the number of shares in issue in the period.Why is this important?
Shows our ability to construct a portfolio that delivers a secure and growing income, which underpins progressive dividend payments to shareholders.How we performed
We achieved our dividend target for the year of at least 6.4 pence per share.Loan to value ratio (%)